![[Un]Churned by Gainsight](https://substackcdn.com/image/fetch/$s_!7AoO!,w_120,h_120,c_fill,f_webp,q_auto:good,fl_progressive:steep/https%3A%2F%2Fsubstack-post-media.s3.amazonaws.com%2Fpublic%2Fimages%2Ffe2167ac-0bcf-4575-9712-8d5ef3588851_300x300.png)
![[Un]Churned by Gainsight](https://substackcdn.com/image/fetch/$s_!hKlf!,e_trim:10:white/e_trim:10:transparent/h_72,c_limit,f_auto,q_auto:good,fl_progressive:steep/https%3A%2F%2Fsubstack-post-media.s3.amazonaws.com%2Fpublic%2Fimages%2Fe14b36dd-52b9-48a3-9f93-3f6a459d55ff_1344x256.png)
The Attribution Model That Survives Board Scrutiny
How Teresa Anania Built a CS Framework That Holds Up Under Financial Pressure
![[Un]Churned's avatar](https://substackcdn.com/image/fetch/$s_!vkJ0!,w_108,h_108,c_fill,f_webp,q_auto:good,fl_progressive:steep/https%3A%2F%2Fsubstack-post-media.s3.amazonaws.com%2Fpublic%2Fimages%2F0464ad30-26c2-4f32-b429-ae4283dd5586_200x200.png)

Customer Success (CS) often loses budget discussions when they can’t answer the question: what would have happened without our involvement?
Answering this question requires CS leaders to move beyond storytelling and clearly define the tangible outcomes that would be lost if their team did not exist. This clarity has become increasingly critical as companies scale, margins tighten, and post-sales investments must compete with priorities like security research and product development.
If you keep getting asked to defend Customer Success with stories, you’ll soon find that anecdotal stories just don’t survive in a room full of engineers.
Teresa Anania, Chief Customer Officer at Sophos, addressed this by narrowing in on the Customer Success narrative. Throughout her time at Autodesk, Zendesk, and now Sophos, she developed and iterated on attribution models that show where, when, and under what conditions Customer Success drives measurable outcomes.
What follows is how her attribution model was built, along with the constraints that led executives to trust the results.
Why Most CS Metrics Fail When Money Is on the Line
When presenting to boards, ambiguity undermines credibility. Metrics such as Net Promoter Score (NPS), health scores, and activity volume only show what happened, not what changed as a result of Customer Success.
To create a narrative that definitively proves CS’s impact, you have to go against your instincts. Teresa’s first decision was philosophical: attribution would only cover work that could plausibly alter renewal or expansion behavior. Other activities, while operationally important, would not be included in the analysis.
That decision alone made the model narrower and more defensible.
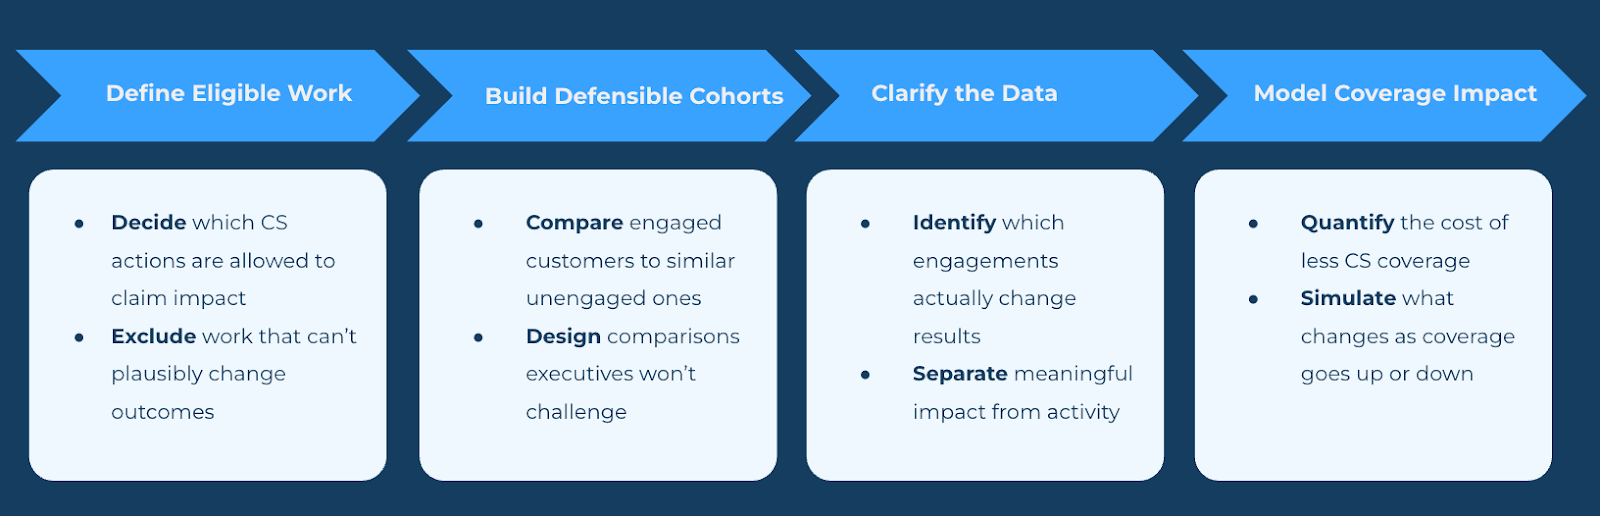
Step 1: Decide What Work Is Allowed to Matter
Before starting analysis, Teresa’s team had to define which Customer Success engagements were eligible for attribution.
To do that, the team built prescriptive playbooks by segment. These playbooks laid out which actions should happen at key points in a customer’s journey.
For Enterprise and Strategic accounts:
Welcome Playbook: Structured onboarding with clear milestones
Quarterly Business Reviews: Templated sessions focused on proof of value delivered—not “how’s it going” calls
Security Posture Reviews: Technical deep dives into the customer’s security footprint
Roadmap Reviews: Product alignment sessions and forward-looking demos
Executive Connect Program: Executive sponsor engagement tied to strategic accounts
For Tech Touch segments:
Onboarding campaigns: Webinar-based programs
Adoption intervention campaigns: Triggered by product usage signals
Renewal preparation campaigns: Webinar plus targeted 1:1 outreach for key accounts
Notably excluded were relationship check-ins, reactive escalations, and ad hoc conversations. While interactions mattered, they could not claim renewal impact by association.
It’s at this step where models often break. Teams naturally want attribution to validate their efforts. Teresa addressed this by designing an attribution model to check what really moved the needle.
Step 2: Build Cohorts You’d Defend in a Boardroom
With eligible activities defined, the next challenge was comparison. Attribution only works if you’re comparing customers who received help versus those who didn’t. For each activity type and segment, customers were grouped into three cohorts:
Unengaged look-alikes, matched on segment, ARR, tenure, geography, and baseline health
Engaged accounts, which received the defined engagement within a six-month window
Highly engaged accounts, which received the engagement at or above the intended cadence
To avoid rewarding last-minute saves or recency bias, outcomes weren’t measured immediately. Renewal and adoption results were evaluated on a rolling six months post-engagement window, adding credibility to the correlation as it takes time to influence renewal outcomes. If you look too close to the renewal, you’re just measuring heroics. Teresa understood that her team needed distance so the signal could show up.
Step 3: Clarify What the Data Shows
Once the cohorts and look-back window were set, the data started doing its real job: narrowing what Customer Success could credibly claim as impact.
For high-touch and strategic accounts, those who received the Customer Success Manager (CSM) high-value engagement renewed more often than similar customers who didn’t. The CSMs who adhered to the full engagement touchpoint plan did even better. The exact numbers were less important than the trend. Some efforts actually changed customer outcomes; others mostly felt meaningful but didn’t move the needle.
The data kept pointing to a few simple truths:
Structured, outcome-driven engagements mattered. Customers who received them renewed at higher rates than similar, unengaged accounts.
Consistency amplified impact. Accounts that received the full engagement plan outperformed those with less frequent touch.
Not all playbooks earned their keep. Some activities showed little or no correlation with renewal and lost their claim to commercial impact.
Tech-touch worked selectively. Targeted intervention campaigns outperformed broad onboarding or webinar programs, which still helped but delivered smaller, more predictable lift.
Once Teresa and her team clarified what was and wasn’t working, they were a step closer to answering what happens when CS isn’t there. Realistically, this doesn’t show up as removing CS altogether but as changes in coverage. What would happen if there were fewer accounts touched or entire segments without an assigned CSM?
To answer this question, they shifted their focus to understanding how much coverage it takes to see results and how much risk is incurred if coverage changes.
Step 4: Translate Engagement Into Coverage Economics
Attribution only becomes useful when you can model what happens as coverage goes up or down. The math itself was intentionally simple:
Coverage percentage based on CSM capacity and portfolio size
Total Book of Business (BoB) ARR
Observed renewal uplift attributable to engagement
Multiplying those inputs produced a dollar figure tied to coverage. That figure could then be adjusted to simulate changes, such as adding headcount, reducing coverage, or shifting certain customer segments to tech-touch only.
Once this model existed, headcount discussions can take on a different tone. Optimizing CS spend stopped being about efficiency and became a trade-off discussion about renewal risk. Executives may still make tough resourcing decisions, but the trade-off risk can be measurable and helpful in linking those decisions to Company retention targets.
How the Model Actually Gets Used
Once activity attribution was in place, it stopped living in dashboards and started showing up in decisions that had previously relied on industry benchmarks or opinion. Here are three situations in which Teresa was able to apply this attribution:
1. Capacity Planning Linked to Coverage Impact
Instead of starting with industry ratios, Teresa’s team flipped the script and started with coverage. The attribution model can help determine the optimal segmentation strategy where you get the biggest bang for your buck in human coverage across your BoB:
Where does it make the most sense to assure High-Touch coverage and what is the GRR and NRR impact of that?
The historical uplift tied to those engagements.
How much ARR was coming up for renewal to quantify impact by quarter.
Sometimes, optimizing coverage (i.e., widening ratios, scaling CS to tech touch, etc.) looked smart on paper, but the renewal risk was way higher than the savings. Other times, the model can help determine where it isn’t worth adding more CSMs when tech touch can be a way to scale. The model can make both calls clear.
2. CSM Capacity Becomes Easier to Evaluate
Portfolio sizing debates also shifted. Rather than using only industry benchmarks, the team looked at where attribution impact began to degrade as account loads increased. That point became the boundary, once outcomes flattened and then declined.
This way of thinking reframed capacity discussions. Instead of asking more from CSMs, the strategy shifted to identifying where the work no longer produced accretive results.
3. Performance Conversations Happened Sooner
Attribution changed how the team handled performance by surfacing risks well before renewals. If a portfolio didn’t do well, the team looked at which actions didn’t happen or didn’t work, rather than just explaining the numbers after the fact.
It became easier to spot the team’s strong performers. CSMs who consistently executed the prescriptive playbooks showed measurable uplift compared to similar portfolios, making it harder to dismiss the differences as luck or account quality.
What made this workable was consistent logging, a restrained scope, and accepting that some work would never be attributed. The model allowed Teresa and her team to identify, reward, and replicate what actually changed outcomes.
Where AI Helps (and Where It Doesn’t)
AI only came into play after the CS impact attribution model had already set some guardrails. The order mattered—a lot. If you don’t know which actions actually move the needle, AI just gets you doing more stuff, not better stuff.
When the timing was right, AI turned into a force multiplier. Suddenly, Teresa’s team could do a few things faster and more reliably than if they were flying solo:
Refine segmentation by identifying which customers benefited most from which playbooks, based on observed attribution lift rather than assumed value.
Adjust engagement cadence by showing where additional touchpoints produced diminishing returns, making it easier to scale back human effort without losing impact.
Scale tech-touch execution in segments where attribution showed marginal human lift, allowing automation to replace work that was already proven to be low leverage.
What AI did not do was create causality. It didn’t tell the team what mattered. It only helped them act on what the attribution model had already made clear.
That’s an easy (and risky) line to blur. Without attribution, AI just speeds up uncertainty. It makes everyone busy, but mostly just doubles down on old assumptions. When attribution comes first, though, AI amplifies what already works and helps cut out the noise.
That’s why Teresa used AI as a finishing touch, not the centerpiece. The model had to prove itself before it got automated.
What This Model Ultimately Forces
Creating a CS impact attribution model can cause a ripple effect that goes beyond technical impact to an organizational one. Once the model exists, Customer Success loses the ability to rely solely on narrative. Low-impact work, performance variances, and coverage risks are out there for everyone to see. Meanwhile, other efforts are shifted out of focus if they’re not directly impacting retention or revenue.
As Teresa put it during our conversation, “You have to be okay knowing some of the work will never show up. If you try to force it, you lose credibility.”
That discomfort is precisely why the model holds up under scrutiny. The true value comes from proving CS is a revenue driver. Once that argument is clear, leadership can move forward with what they’re willing to invest in and what they’re willing to give.
About This Article
This article draws from a detailed conversation with Teresa Anania, Chief Customer Officer at Sophos, on how to build Customer Success attribution models that hold up under executive and board-level scrutiny. Teresa has refined this methodology across multiple organizations, including Zendesk and Autodesk, adapting it to different customer segments, operating models, and growth stages. All data referenced here has been sanitized to protect confidential business information.
 | A guest post by
|